Vattensmart
Case study:
Vattensmart, is focused on water consumption. Provided by Laholmsbuktens VA and Vatten & Miljö i Väst AB, a challenge to increase awareness around smart water usage.
Our product concept aims to facilitate small and medium-sized businesses to track their water consumption and increase awareness around water efficiency. It serves as a bridge between increased awareness and concrete actions.
This project was part of a Design Studio initiative, where we work in design teams for real clients as part of our studies at the University of Halmstad.
Client
LBVA & VIVAB AB
Time range
6 weeks
My role
UX Researcher
Design team
6 people
Assignment description
The worst water scarcity on record in Sweden occurred in 2018. Small and medium-sized enterprises were severely affected by this crisis, causing many to shut down. A significant number of businesses are uninformed about alternative water sources and tend to underestimate their water requirements.
Our attitude towards water as a resource needs to change. It raises questions about the appropriate use of drinking water, such as using it for car washes or to water golf courses. Being water smart in this case means using the right type of water for the right purpose and avoiding the use of drinking water where it is not necessary.
Therefore, a future service that can raise awareness about water consumption in businesses and provide them with additional incentives should be developed. The conceptual service envisions a future scenario where mapping is done automatically. LBVA and VIVAB are also more involved by providing active advice to businesses.
Problem identification
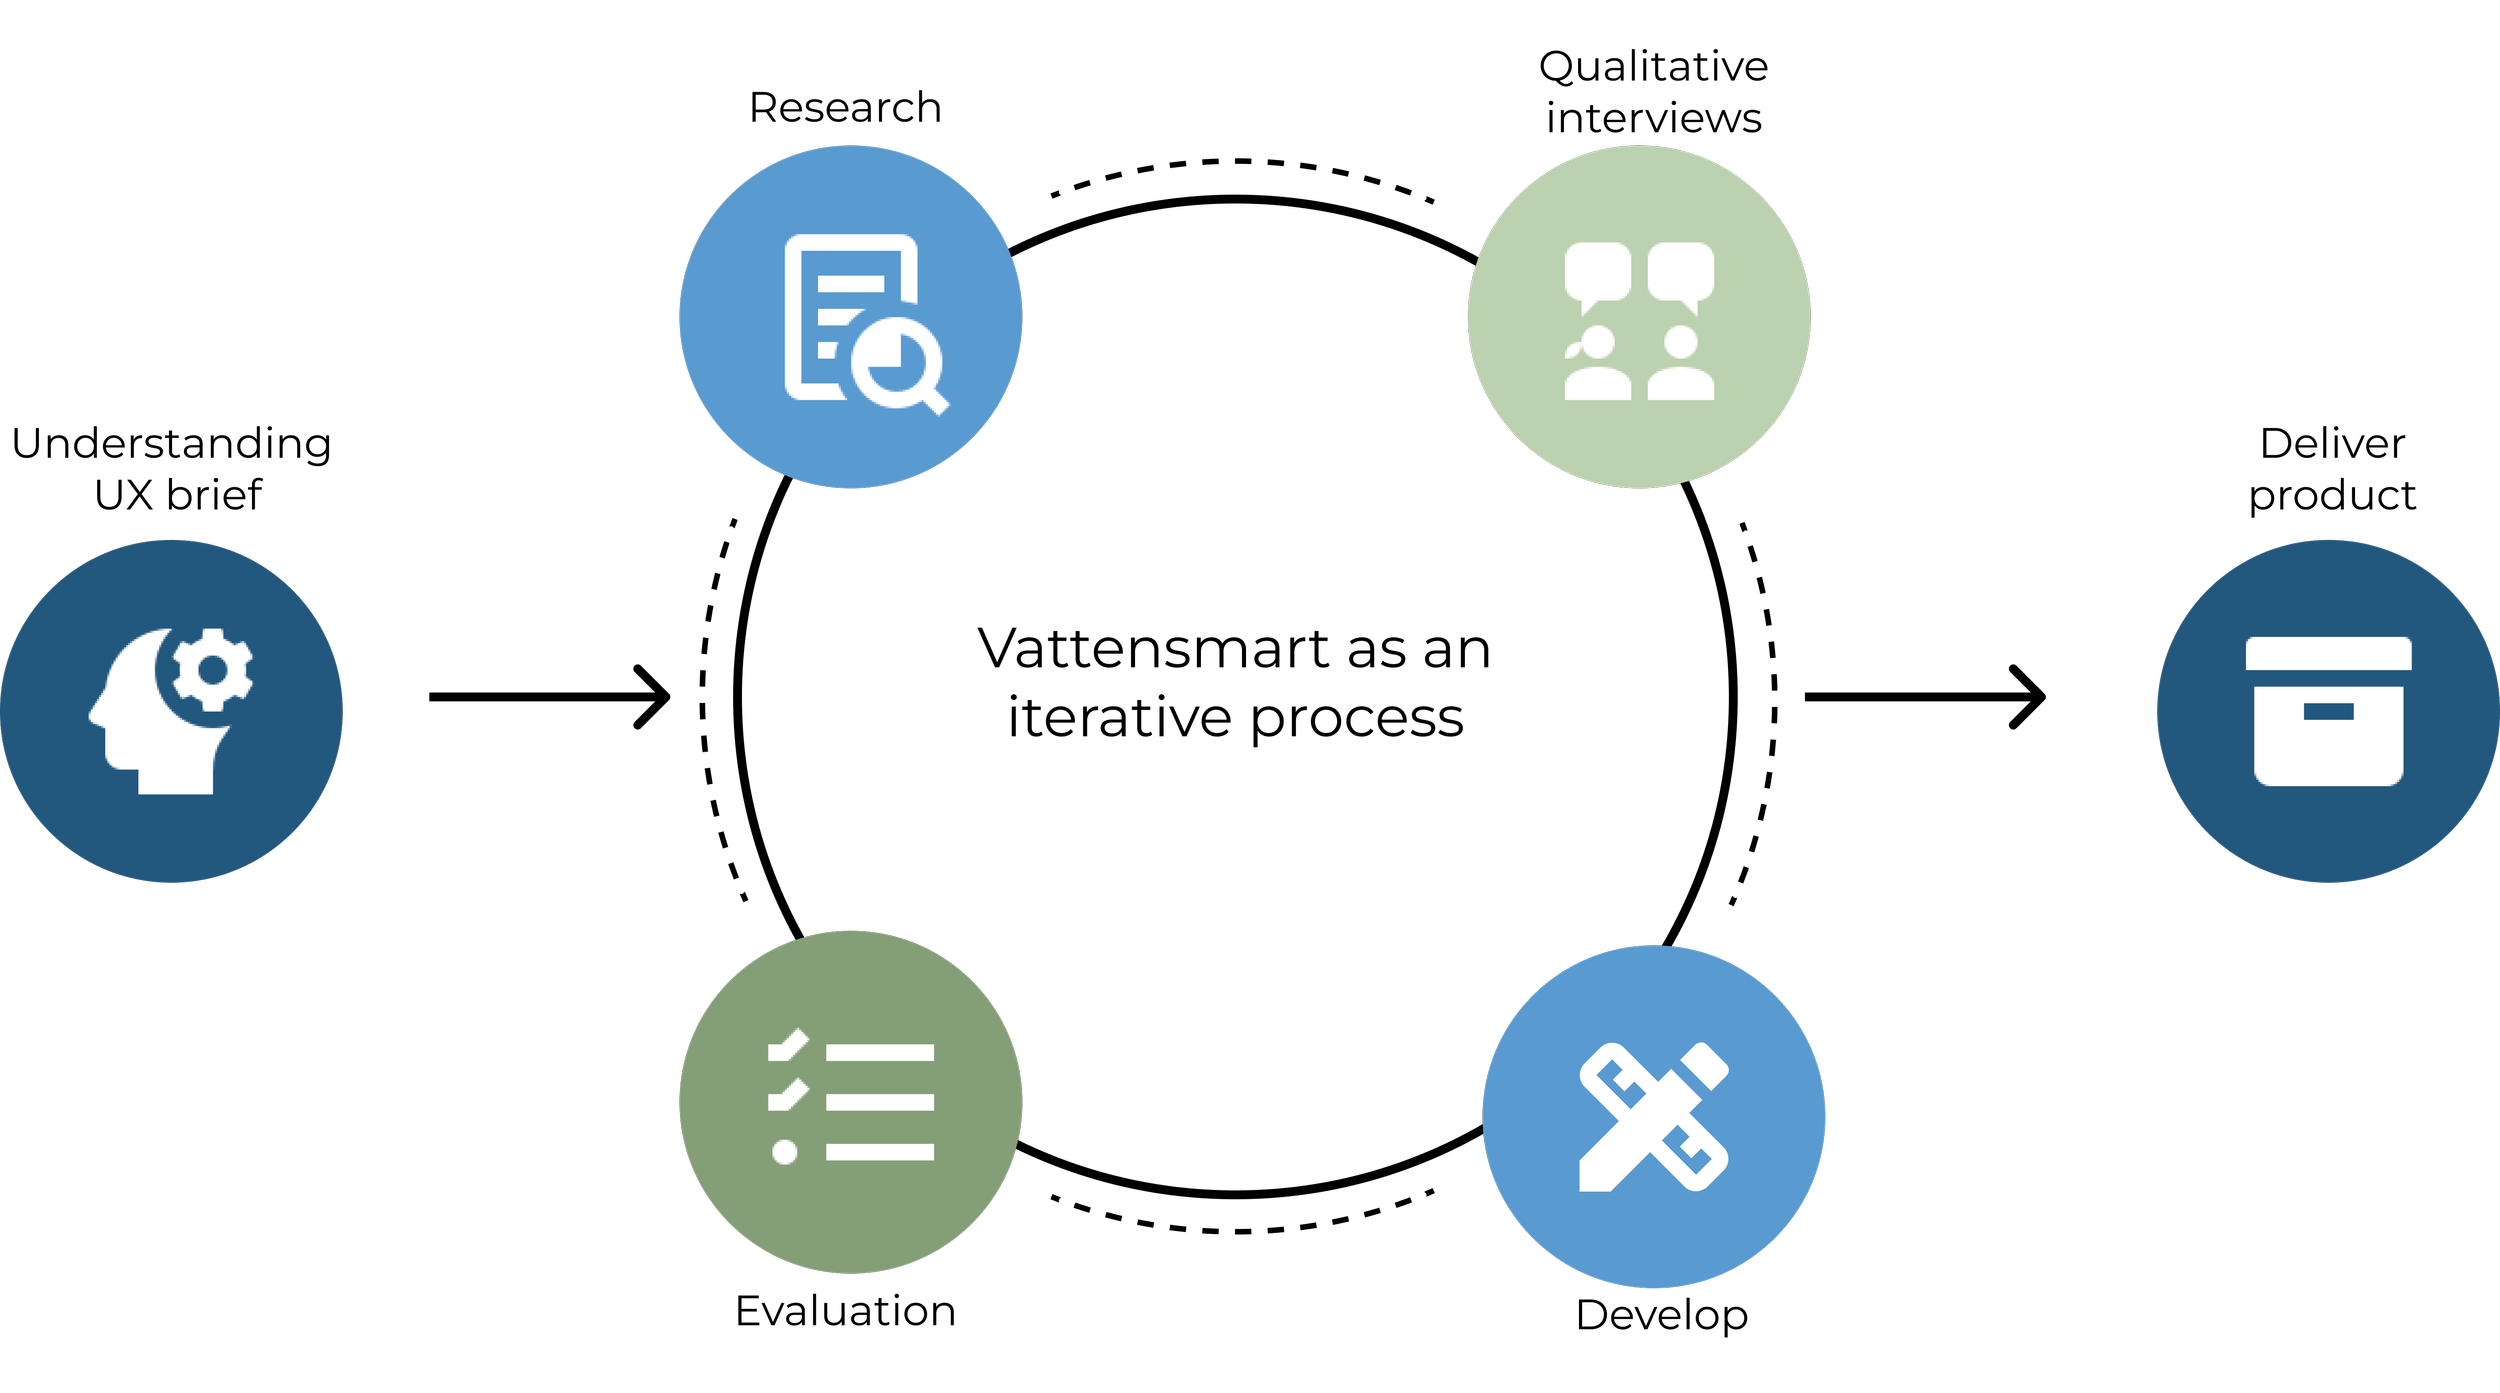
The brief initially outlined four main areas, which were further specified in the later stages of the process: "Changing the perception of water," "How can we promote understanding?," "How is water viewed as a resource?," and "How can we conserve and protect water resources?" There was a clear need for the project team to delve deeper into the problem area to expand their knowledge
Understanding
Research & Environmental analysis
Intervews
Understanding
To understand the perspective on water consumption, we gathered knowledge from LBVA about current efforts to increase awareness around water as a resource and the possible actions to implement. Additionally, we interviewed businesses to understand their views on water consumption and what motivates them to become water smart. We also used a previous project report where a company was commissioned by LBVA to develop a water mapping tool, which provided further information for our proposed solution.
Lack of knowledge
During our desktop research, we found a significant lack of knowledge related to how businesses can become water-smart and what the concept of water-smart encompasses. We also identified a lack of incentives for companies to become water-smart.
Currently, there is no service offering expert advice or water mapping for businesses. This means that companies have to map their own water consumption and identify measures. This can be difficult if the company lacks expertise in this area.
The information available is inadequate and also difficult to access even if a company actively seeks it. Therefore, it can be assumed that a larger amount of resources must be allocated to identify water-smart measures without expert help.
The brief mentions the concept of water smartness, but the project team could not find a clear definition that explains what water smartness means. This may be due to the fact that the concept of water smartness is not sufficiently recognized in today's socio-economic sphere, and the definition may differ in other parts of the world. An environmental analysis was conducted to see how other countries' perspectives on water and their management of drinking water differ from those in Halland County.
Research & Environmental analysis
Interviews
Companies actively working with large amounts of water are more aware of their water consumption and often take measures to be more water-smart. In contrast, companies that do not actively work with large amounts of water tend to live in a conscious or unconscious ignorance.
There are more motivations and a higher focus on energy saving than on water saving. During the interviews, several different certifications related to energy consumption that companies can obtain were mentioned. This is something that could be explored related to water as well. With the same approach as in energy consumption certifications, water consumption certifications can be developed.
The information available to companies is inadequate if the company does not want to spend its own resources on developing measures. Therefore, companies need to be informed by each other or by LBVA and VIVAB with concrete suggestions or techniques on how to use water in a water-efficient manner.
To gain insights from their perspective, the design team conducted interviews with both small and medium-sized enterprises that actively worked with water and those that did not.
The project team based their development of qualitative questions for business interviews on COWI's report, which focused on three different business categories: 1) tourism and hospitality, 2) green growth/agricultural production, and 3) health innovation.
A total of seven qualitative interviews were conducted, in which the project team selectively attempted to match businesses in the three identified areas of strength, including two pilot interviews. Through these interviews, it became apparent that...
Service design & Conceptualization
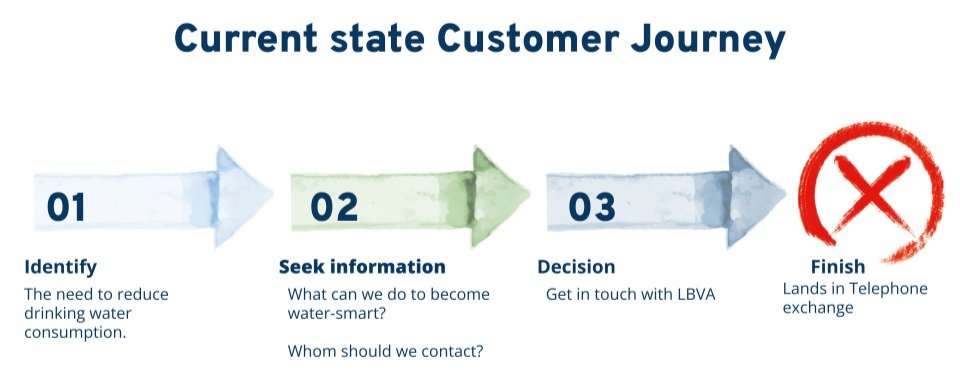
Current customer journey
To develop a future concept, we must first analyze the current situation. We created a "current customer journey" that describes the user experience from the customer's perspective. It lists both needs and pain points in the process that the customer goes through. This forms the foundation for identifying gaps and how new values or improvements can be created. Currently, a customer who contacts LBVA via email or phone unknowingly ends up in a queue at a municipal switchboard, resulting in an abrupt end to their journey.
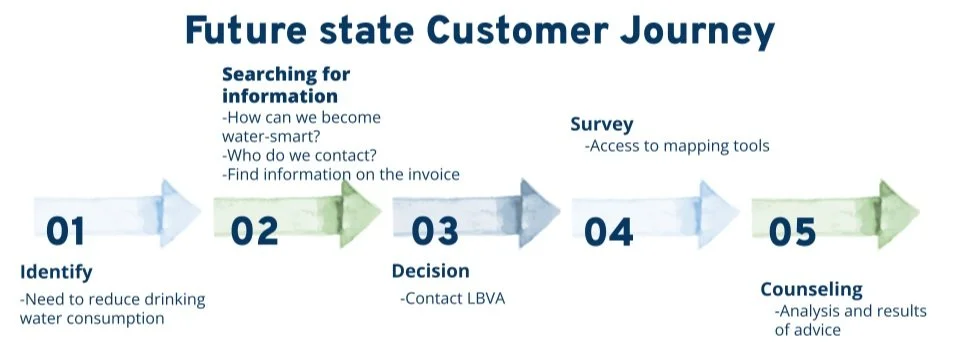
Future state customer journey
By providing guidance, which can potentially be provided after a water survey, we created a "future state customer journey." Here, the customer journey is performed with the ultimate goal of mapping their water consumption and receiving guidance using today's technology. We identified that more touchpoints pointing to guidance or water smartness need to be established, such as advertising on the customer's invoice. However, this requires many man-hours to reach its full capacity, both in investment and in training time.
Preferred state customer journey
In our final example, we switch gears and think ahead. This is done in our preferred customer journey, where we try to eliminate analog processes as much as possible and replace them with digital technology where the customer can see and reduce their water consumption in real-time. This saves on both the customer's and LBVA & VIVAB's resources from a long-term perspective. Instead of actively calculating an estimate of their consumption, which may help to get a daily estimate of what the company is consuming, the answers are already available in the form of a technological modernization.
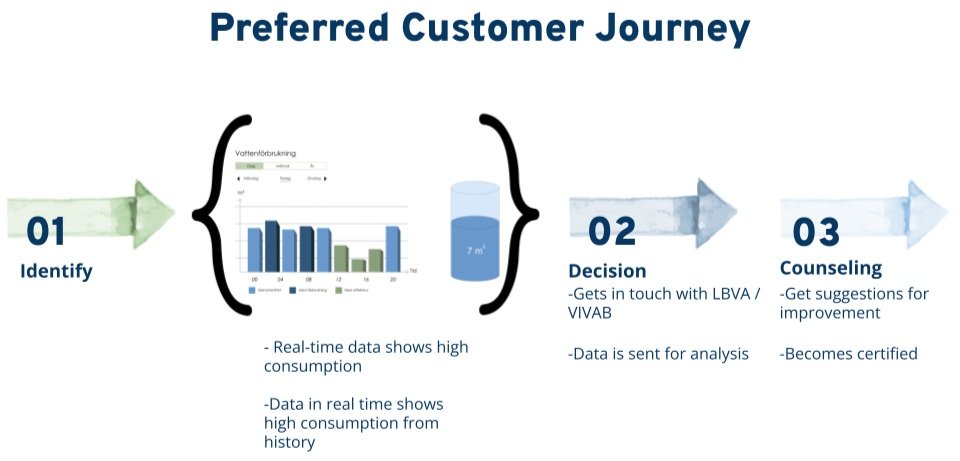
“Early sketch over the concept of the preferred state” —>
Service blueprint
A service blueprint was created based on the preferred future state customer journey and a scenario. The service blueprint illustrates how the service works from a more technical perspective when the customer interacts with different parts of the service.
The team decided to use the service blueprint to represent the three different stages present in a preferred future state customer journey. These stages are identifying the need for advice, booking advice, and receiving advice results. The customer actions section at the top of the service blueprint shows the interactions a company performs related to the interface. The next stage is frontstage actions, which aims to show what LBVA and VIVAB employees do in the service flow that companies can see. In the third stage, technology, the technology that companies interact with is illustrated. The primary technology that companies interact with is the interface. In the fourth stage, backstage actions, what LBVA and VIVAB employees do that companies cannot directly see but must still be performed is shown. The fifth stage, backstage support process, illustrates the database and how it communicates with the other parts of the service.
Business model canvas
The business model canvas was developed based on a customer journey and a service blueprint to demonstrate the value that the service provides to users, LBVA, VIVAB, and the environment. The canvas illustrates how the service can simplify mapping and make it easier for companies to monitor their water consumption.
Additionally, the business model canvas shows the potential impact that the service could have on the environment from a climate-smart perspective. By providing companies with a more detailed picture and control over their water consumption, it is expected that they will become more water-efficient in a future where drinking water scarcity may become more pronounced.
Service roadmap & service specification
As part of our service design approach, we have created a service roadmap and a service specification. These include a plan for how LBVA and VIVAB could implement the services developed over a period of 8 years.
The plan encompasses everything from database development to advisor training. The roadmap is important because it answers three critical questions: Where are we now? Where do we want to go? And how can we get there?
Conceptual visualization
Wireframes and sketches were created to illustrate how the interface connected to the future service could look. A market analysis was conducted where the project team investigated how interfaces were designed in similar areas. One of these areas was energy consumption, where graphs and curves are commonly used to provide users with an overview of their energy consumption.
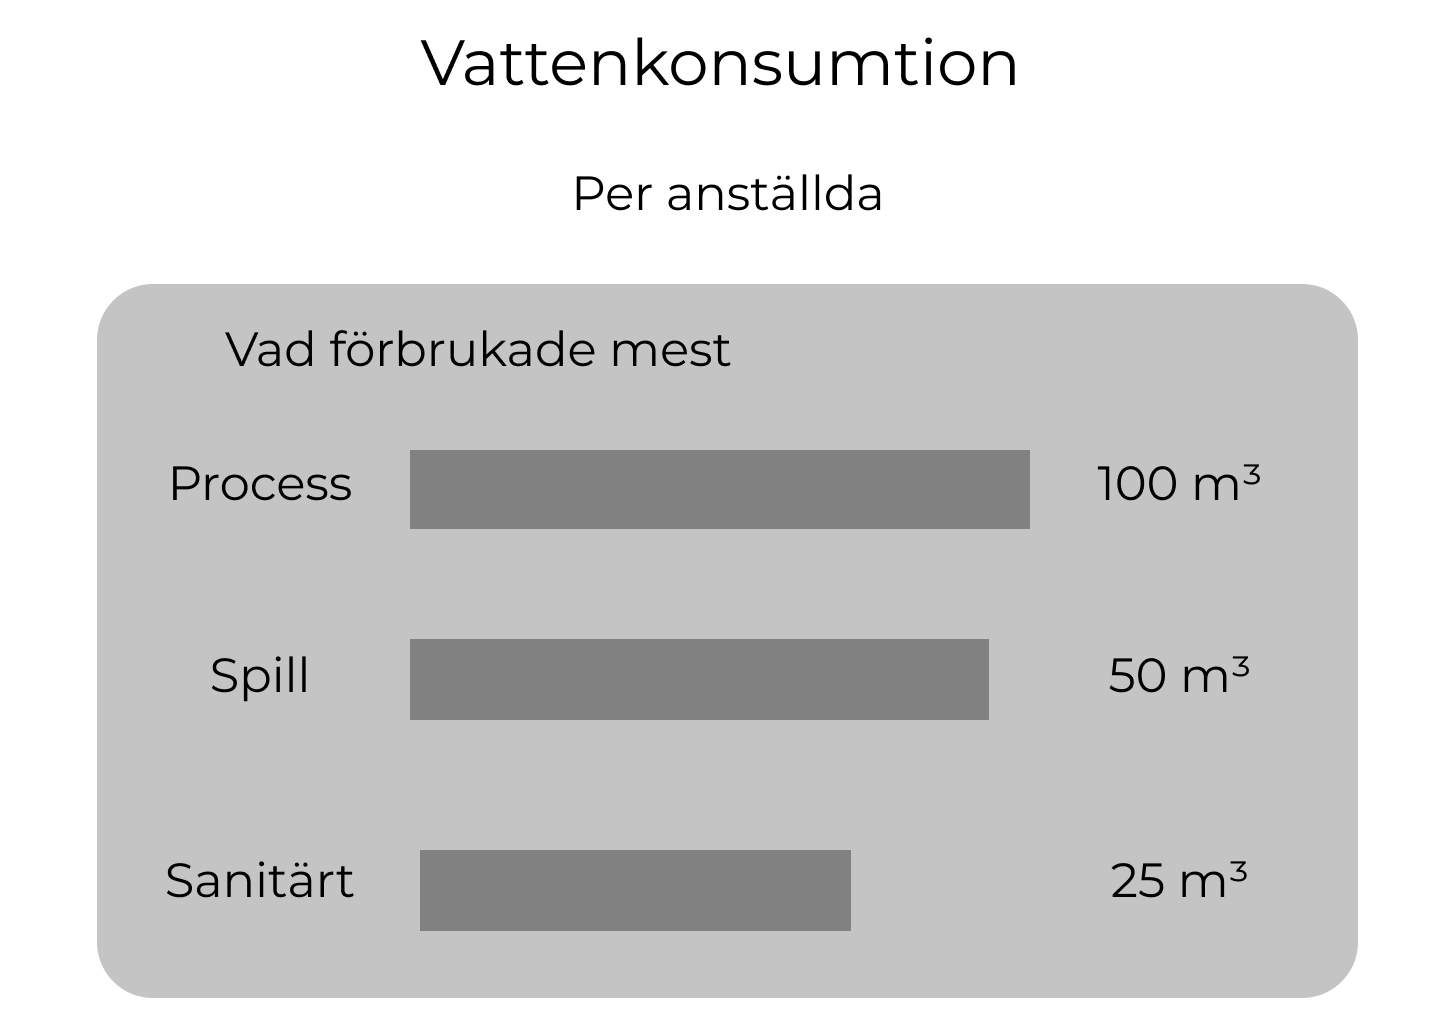
The project team discussed whether three-dimensional bars would be a more ideal way to visualize water consumption. This was discussed because large amounts of water are often measured in cubic meters, which are measured in three dimensions. Thus, two-dimensional graph bars were considered to provide a misleading perception of the actual water quantity. Low-fidelity prototypes were presented to the project team's student colleagues during a critique session.
Information architecture in the prototypes was also criticized during the critique session. Some prototypes were considered overwhelming or boring, resulting in changes to the information architecture.
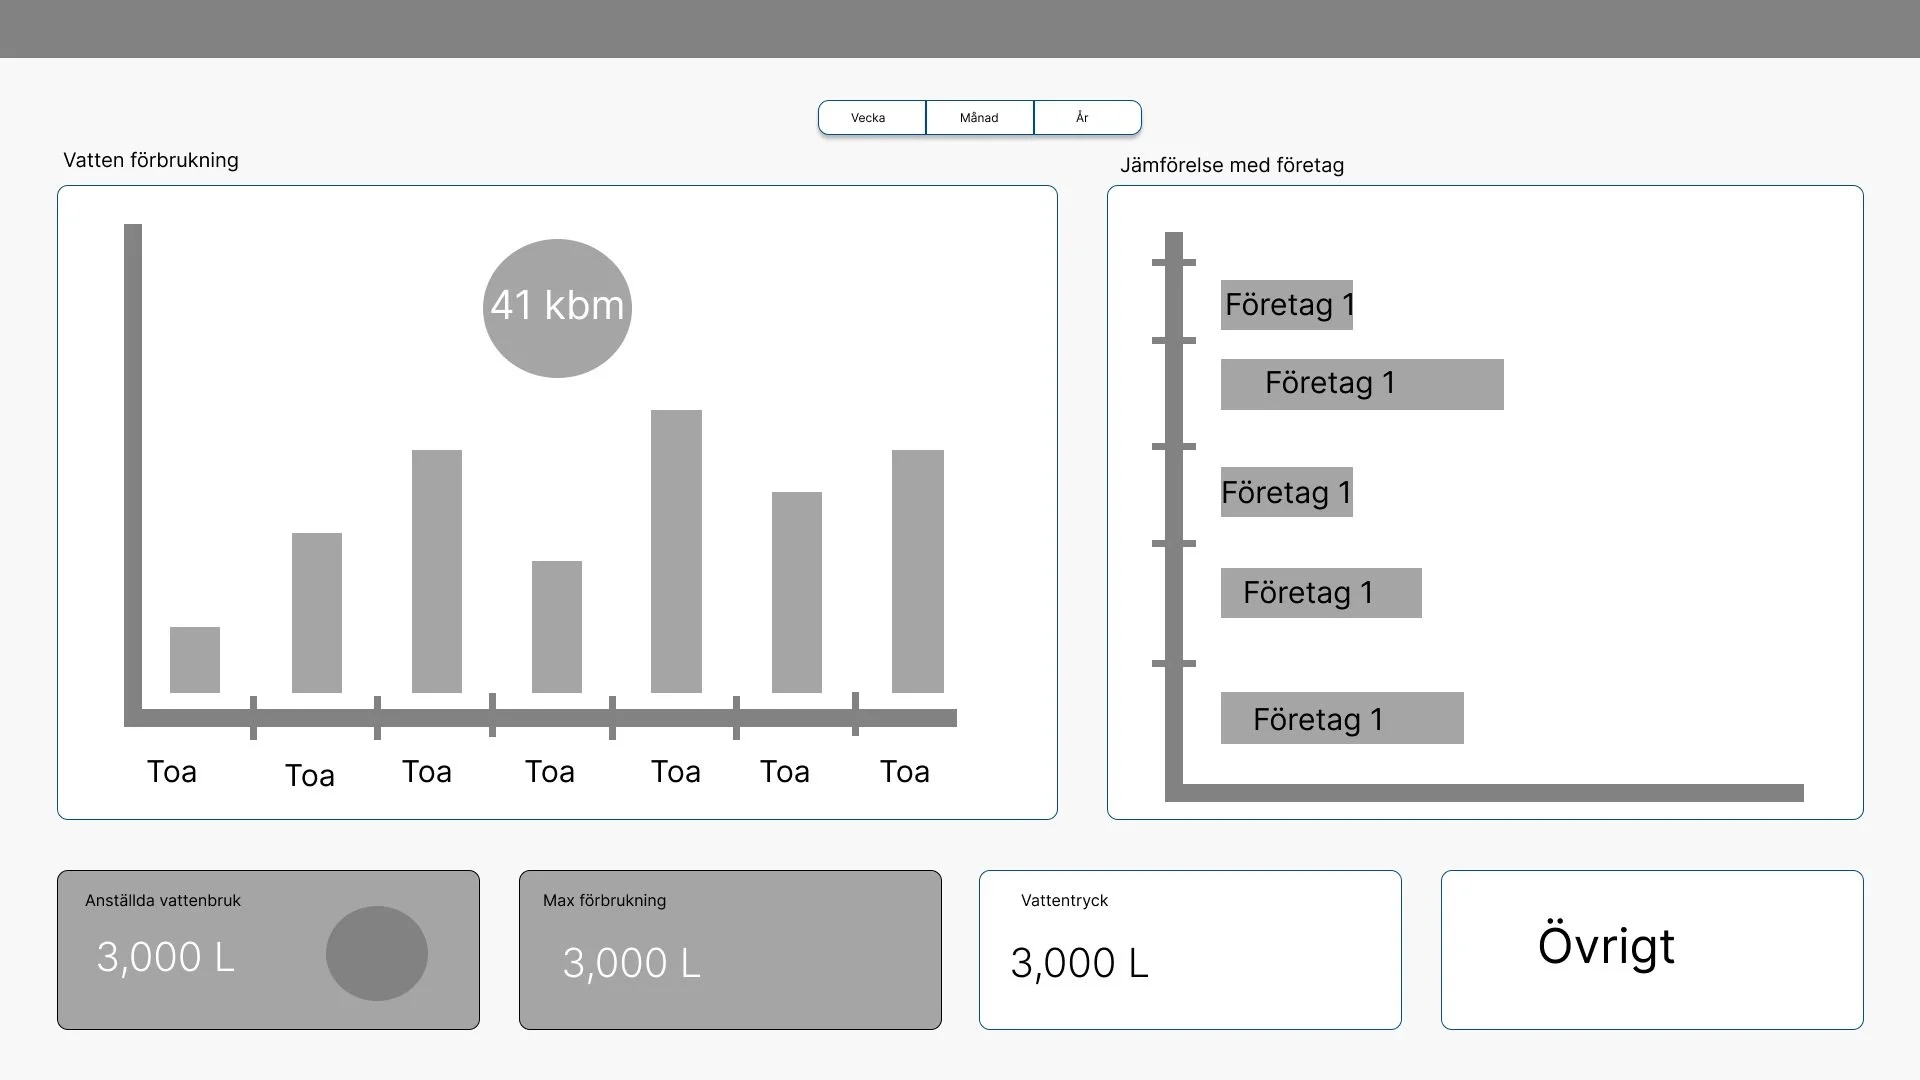
This is how we have created the final web page. It is based on research material and analysis from interviews, and has gone through several iterations based on guidance, critique sessions, and evaluations. The main analysis page that we have focused on is a conceptualization for the future, suitable for a smart society, where digital water meters automatically input values for each water meter into the analysis page. The color scheme is inspired by both LBVA and VIVAB's colors, and aims to convey a sense of calm natural environment.
The app follows the same system as the website, but with more scrolling. The main difference is that in the app, one cannot tap into the graphs specifically as we wanted to keep the app more comprehensive. As you can see in the last dark blue bar, a drop appears on the screen with an exact value after tapping the bar with one's finger.
Takeaways
Further development
During the project, we identified different areas that require further development. Starting with the conceptual interface, we realized that more iterations of the interface are needed to meet the target audience's needs effectively. The interface consists of two parts, one for desktop usage and one for mobile. We have identified that separate design work is required because the usage scenarios are so different.
Incentive for certification
If we look at the certificate, we identified that different levels of the certificate may be appropriate. One level for when consultation has been provided and another when the company has taken qualified measures. We have also identified that the certificate should be renewed annually or every five years. This provides companies with another incentive to continue being water smart.
Designing the certificate will also require work with the companies to determine how the certificate can be formulated.
Wicked problem
Throughout the process, we gained a lot of knowledge about water, water smartness, and how businesses and the general public are supplied with water. We have also come to realize that today's water consumption is a wicked problem that does not have a single solution but requires multiple ones. The concept we presented to you today is a solution for how businesses can strive for a more sustainable future. We have learned that creating sustainable incentives can bring about change without necessarily relying on economic incentives.